

Fiscal 2019 GAAP diluted net earnings per share (“EPS”) of $2.07, below the previously provided outlook of $2.31 to $2.35 per share
Fiscal 2019 non-GAAP diluted net EPS of $2.24, above the previously provided outlook of $2.18 to $2.22 per share
Fiscal 2019 net revenue of $58.8 billion, up 0.5% from the prior-year period
Fiscal 2019 net cash provided by operating activities of $4.7 billion, free cash flow of $4.0 billion
Fiscal 2019 returned $3.4 billion to shareholders in the form of share repurchases and dividends
Fourth quarter GAAP diluted net EPS of $0.26, below the previously provided outlook of $0.51 to $0.55 per share
Fourth quarter non-GAAP diluted net EPS of $0.60, above the previously provided outlook of $0.55 to $0.59 per share
Fourth quarter net revenue of $15.4 billion, up 0.3% from the prior-year period
Fourth quarter net cash provided by operating activities of $0.6 billion, free cash flow of $0.4 billion
Fourth quarter returned $0.7 billion to shareholders in the form of share repurchases and dividends
HP Inc.'s fiscal 2019 full-year and fourth quarter financial performance
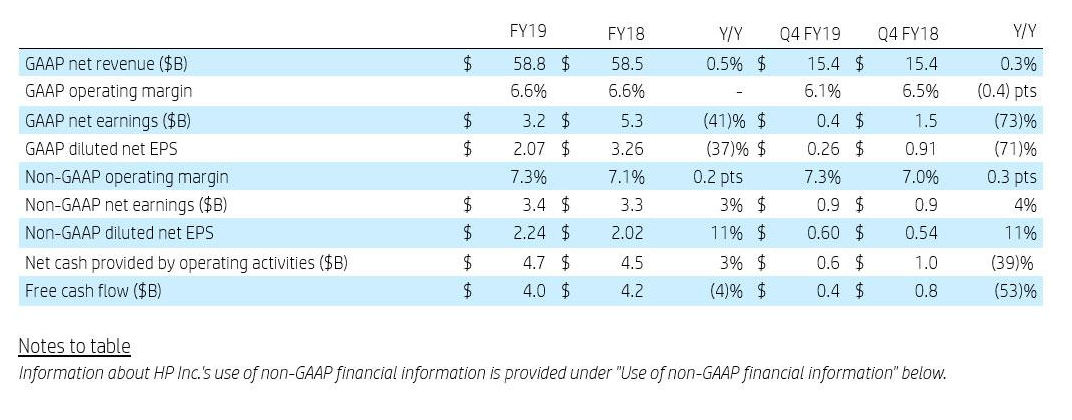
Net revenue and EPS results
HP Inc. and its subsidiaries (“HP”) announced fiscal 2019 net revenue of $58.8 billion, up 0.5% (up 2.0% in constant currency) from the prior-year period.
Fiscal 2019 GAAP diluted net EPS was $2.07, down from $3.26 in the prior-year period and below the previously provided outlook of $2.31 to $2.35. Fiscal 2019 non-GAAP diluted net EPS was $2.24, up from $2.02 in the prior-year period and above the previously provided outlook of $2.18 to $2.22. Fiscal 2019 non-GAAP net earnings and non-GAAP diluted net EPS exclude after-tax adjustments of $257 million, or $0.17 per diluted share, related to restructuring and other charges, acquisition-related charges, amortization of intangible assets, non-operating retirement-related credits/(charges), and tax adjustments.
Fourth quarter net revenue was $15.4 billion, up 0.3% (up 1.8% in constant currency) from the prior-year period.
Fourth quarter GAAP diluted net EPS was $0.26, down from $0.91 in the prior-year period and below the previously provided outlook of $0.51 to $0.55. Fourth quarter non-GAAP diluted net EPS was $0.60, up from $0.54 in the prior-year period and above the previously provided outlook of $0.55 to $0.59. Fourth quarter non-GAAP net earnings and non-GAAP diluted net EPS exclude after-tax adjustments of $511 million, or $0.34 per diluted share, related to restructuring and other charges, acquisition-related charges, amortization of intangible assets, non-operating retirement-related credits/(charges), and tax adjustments.
“2019 marks our third consecutive year of revenue, non-GAAP operating profit and non-GAAP earnings growth, with non-GAAP EPS up 11% and strong free cash flow of $4 billion,” said Enrique Lores, President and CEO, HP Inc. “We delivered an excellent Q4, with 11% non-GAAP EPS growth. Our strategy is working and we are confident in our business heading into FY20.”
Asset management
HP generated $4.7 billion in net cash provided by operating activities and $4.0 billion of free cash flow in fiscal 2019. Free cash flow includes net cash provided by operating activities and net investments in property, plant and equipment of $0.7 billion. HP utilized approximately $2.4 billion of cash during fiscal 2019 to repurchase approximately 118 million shares of common stock in the open market. When combined with the almost $1.0 billion of cash used to pay dividends, HP returned 85% of its free cash flow to shareholders in fiscal 2019.
HP’s net cash provided by operating activities in the fourth quarter of fiscal 2019 was $0.6 billion. Accounts receivable ended the quarter at $6.0 billion, up 2 days quarter over quarter to 35 days. Inventory ended the quarter at $5.7 billion, down 3 days quarter over quarter to 41 days. Accounts payable ended the quarter at $14.8 billion, down 6 days quarter over quarter to 107 days.
HP generated $0.4 billion of free cash flow in the fourth quarter. Free cash flow includes net cash provided by operating activities and net investments in property, plant and equipment of $0.2 billion.
HP’s dividend payment of $0.1602 per share in the fourth quarter resulted in cash usage of $0.2 billion. HP also utilized $0.5 billion of cash during the quarter to repurchase approximately 25 million shares of common stock in the open market. As a result, HP returned 178% of its fourth quarter free cash flow to shareholders. HP exited the quarter with $4.5 billion in gross cash, which includes cash and cash equivalents.
Fiscal 2019 fourth quarter segment results
Personal Systems net revenue was up 4% year over year (up 5% in constant currency) with a 5.3% operating margin. Commercial net revenue increased 8% and Consumer net revenue decreased 4%. Total units were up 8% with Notebooks units up 9% and Desktops units up 5%.
Printing net revenue was down 6% year over year (down 5% in constant currency) with a 15.6% operating margin. Total hardware units were down 9% with Commercial hardware units down 1% and Consumer hardware units down 10%. Supplies net revenue was down 7% (down 7% in constant currency).
Outlook
For the fiscal 2020 first quarter, HP estimates GAAP diluted net EPS to be in the range of $0.39 to $0.42 and non-GAAP diluted net EPS to be in the range of $0.53 to $0.56. Fiscal 2020 first quarter non-GAAP diluted net EPS estimates exclude $0.14 per diluted share, primarily related to restructuring and other charges, acquisition-related charges, defined benefit plan settlement charges, amortization of intangible assets, non-operating retirement-related credits/(charges), tax adjustments and the related tax impact on these items.
For fiscal 2020, HP estimates GAAP diluted net EPS to be in the range of $2.00 to $2.10 and non-GAAP diluted net EPS to be in the range of $2.24 to $2.32. Fiscal 2020 non-GAAP diluted net EPS estimates exclude $0.22 to $0.24 per diluted share, primarily related to restructuring and other charges, acquisition-related charges, defined benefit plan settlement charges, amortization of intangible assets, non-operating retirement-related credits/(charges), tax adjustments and the related tax impact on these items.
www.hp.com


